Global tourism carbon footprint quantified in world first

For the first time, the world's tourism footprint has been quantified across the supply chain—from flights to souvenirs—and revealed as a significant and growing contributor to greenhouse gas (GHG) emissions.
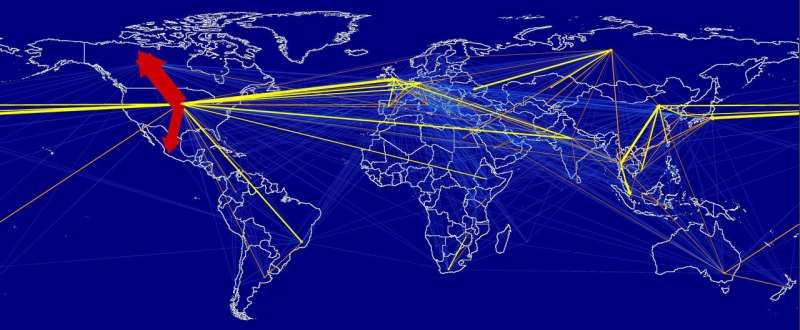
Small islands attract a disproportionate share of carbon emissions, considering their small populations, through international arrivals, while the United States is responsible for the majority of tourism-generated emissions overall.
The research—led by world-leading Integrated Sustainability Analysis supply-chain research group at the University of Sydney—found the global comprehensive tourism footprint of tourism-related greenhouse gas emissions is about four times greater than previous estimates, is growing faster than international trade and is already responsible for almost a tenth of global GHGs.
The researchers recommend financial and technical assistance could help share burdens such as global warming on winter sports, sea-level rise on low-lying islands and pollution impacts on exotic and vulnerable destinations.
A key recommendation: fly less and pay more, for example for carbon abatement.
A paper about the findings, 'The carbon footprint of global tourism', publishes today in the peer-reviewed journal Nature Climate Change.
Corresponding author Dr. Arunima Malik, from the School of Physics, said the complex research took a year and a half to complete and incorporated more than an estimated one billion supply chains and their impacts on the atmosphere.
"Our analysis is a world-first look at the true cost of tourism—including consumables such as food from eating out and souvenirs—it's a complete life-cycle assessment of global tourism, ensuring we don't miss any impacts," Dr. Malik said.

"This research fills a crucial gap identified by the World Tourism Organization and World Meteorological Organization to quantify, in a comprehensive manner, the world's tourism footprint."
Co-author Dr. Ya-Yen Sun, from the University of Queensland's Business School and the National Cheng Kung University, Taiwan, said a re-think about tourism as 'low-impact' was crucial.
"Given that tourism is set to grow faster than many other economic sectors, the international community may consider its inclusion in the future in climate commitments, such as the Paris Accord, by tying international flights to specific nations," she said.
"Carbon taxes or carbon trading schemes—in particular for aviation—may be required to curtail unchecked future growth in tourism-related emissions."
Lead researcher from the University of Sydney, Professor Manfred Lenzen, said the study found air travel was the key contributor to tourism's footprint and that the carbon-intensive industry would comprise an increasingly significant proportion of global emissions as growing affluence and technological developments rendered luxury travel more affordable.
"We found the per-capita carbon footprint increases strongly with increased affluence and does not appear to satiate as incomes grow," Professor Lenzen said.
For holiday-makers, Professor Lenzen said paying for carbon abatement could increase the price of a trip significantly, pointing to previous research* indicating robust offset schemes did not amount to small change.
"To make my own travel more sustainable—for future generations—I invest in long-run abatement options at prices that incorporate at least average abatement costs, like investing in afforestation, rather than assuming only low-hanging fruit, like residential power efficiency."
"If I flew from Melbourne to the UK return, I would pay at least an additional $425** to offset my emissions; for a return trip between Sydney and Brisbane, about $45 extra," Professor Lenzen said.
———
Previous research has quantified the carbon footprint of specific aspects of tourism operations such as hotel, events and transportation infrastructure; and in particular countries or regions.
This new study included 189 individual countries and all upstream supply chains.
The US tops the carbon footprint ranking, followed by China, Germany and India. The majority of these carbon footprints are caused by domestic travel; business travel could not be distinguished from tourism.
In countries such as the Maldives, Mauritius, Cyprus and the Seychelles, international tourism represents between 30 percent and 80 percent of national emissions.
The paper notes international arrivals and tourism receipts have been growing at an annual three percent to five percent—outpacing the growth of international trade.
The study found tourism is forecast to grow at an annual four percent—outpacing many other economic sectors.
Between 2009 and 2013, tourism's global carbon footprint increased from 3.9 to 4.5 Gt CO2-e—four times more than previous estimates—accounting for about 8 percent of global greenhouse gas emissions. Transport, shopping and food are significant contributors.
More information: Manfred Lenzen et al, The carbon footprint of global tourism, Nature Climate Change (2018). DOI: 10.1038/s41558-018-0141-x
* 'The social cost of carbon: estimating the benefits of reducing greenhouse gas emissions'. US Environment Protection Agency 19 January 2017.
** For the purposes of providing an example of average abatement costs of popular trips, Prof Lenzen estimated:
short-haul/domestic flights emit 0.5 kg per passenger kilometre (reference: www.sciencedirect.com/science/ … ii/S1361920999000097) on a life-cycle basis, times typical abatement cost of AU $50/tonne (reference: openknowledge.worldbank.org/bi … 11296.pdf?sequence=4) yields 2.5 cents/km flown, or $45 for a 2x900 km return trip.
long-haul/international flights emit 0.25 kg/pkm on a life-cycle basis (referenece: www.sciencedirect.com/science/ … ii/S1361920999000097), times typical abatement cost of AU $50/tonne (see 1st two References above) yields 1.25 cents/km flown, or $425 for a 2x17,000 km return trip.
(However, if assuming high, rather than average abatement costs, assuming all other abatement options have been exhausted for the longer-term, the cost of abatement could be increased two- or threefold.)
Journal information: Nature Climate Change
Provided by University of Sydney


